T. Pestana, S. Hickel (2020)
Journal of Fluid Mechanics 885: A7. doi: 10.1017/jfm.2019.976
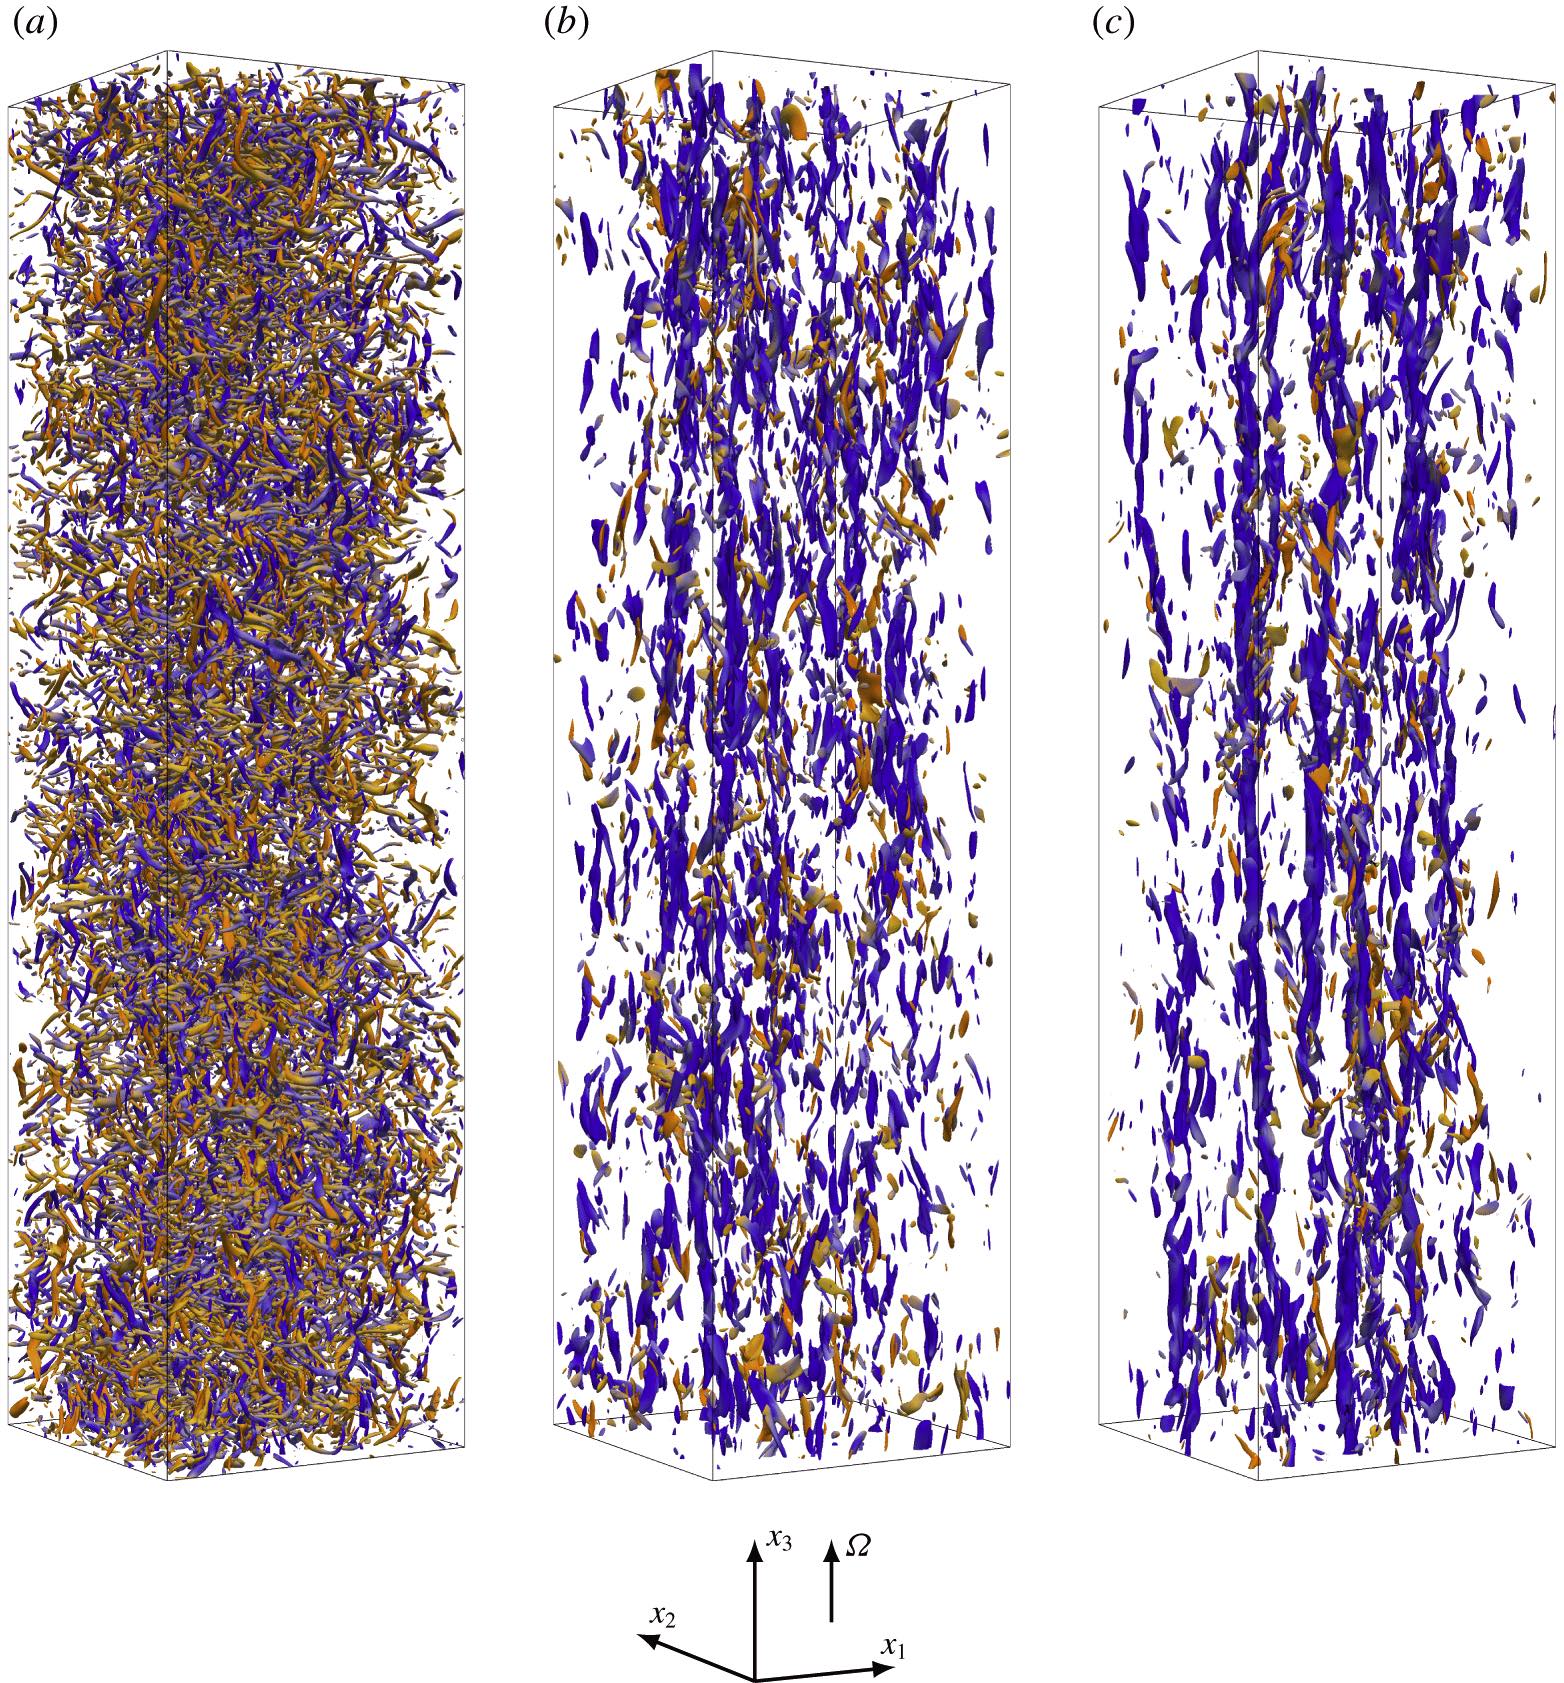
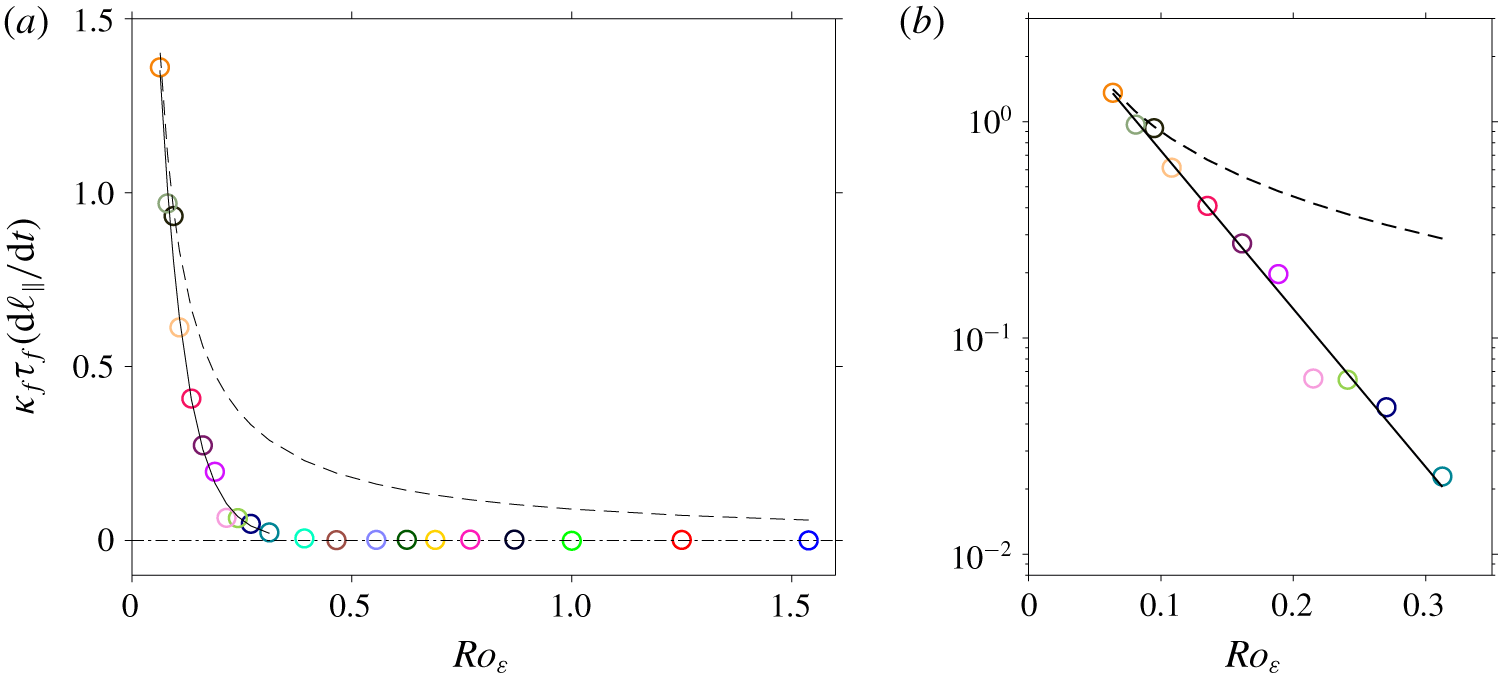
Two aspects of homogeneous rotating turbulence are quantified through forced direct numerical simulations in an elongated domain, which, in the direction of rotation, is approximately 340 times larger than the typical initial eddy size. First, by following the time evolution of the integral length scale along the axis of rotation ℓ‖, the growth rate of the columnar eddies and its dependence on the Rossby number ??? is determined as ?=3.90exp(−16.72???) for 0.06⩽???⩽0.31, where ? is the non-dimensional growth rate. Second, a scaling law for the energy dissipation rate ?? is sought.
Comparison with current available scaling laws shows that the relation proposed by Baqui & Davidson (Phys. Fluids, vol. 27(2), 2015, 025107), i.e. ??∼?′3/ℓ‖, where ?′ is the root-mean-square velocity, approximates well part of our data, more specifically the range 0.39⩽???⩽1.54. However, relations proposed in the literature fail to model the data for the second and most interesting range, i.e. 0.06⩽???⩽0.31, which is marked by the formation of columnar eddies.
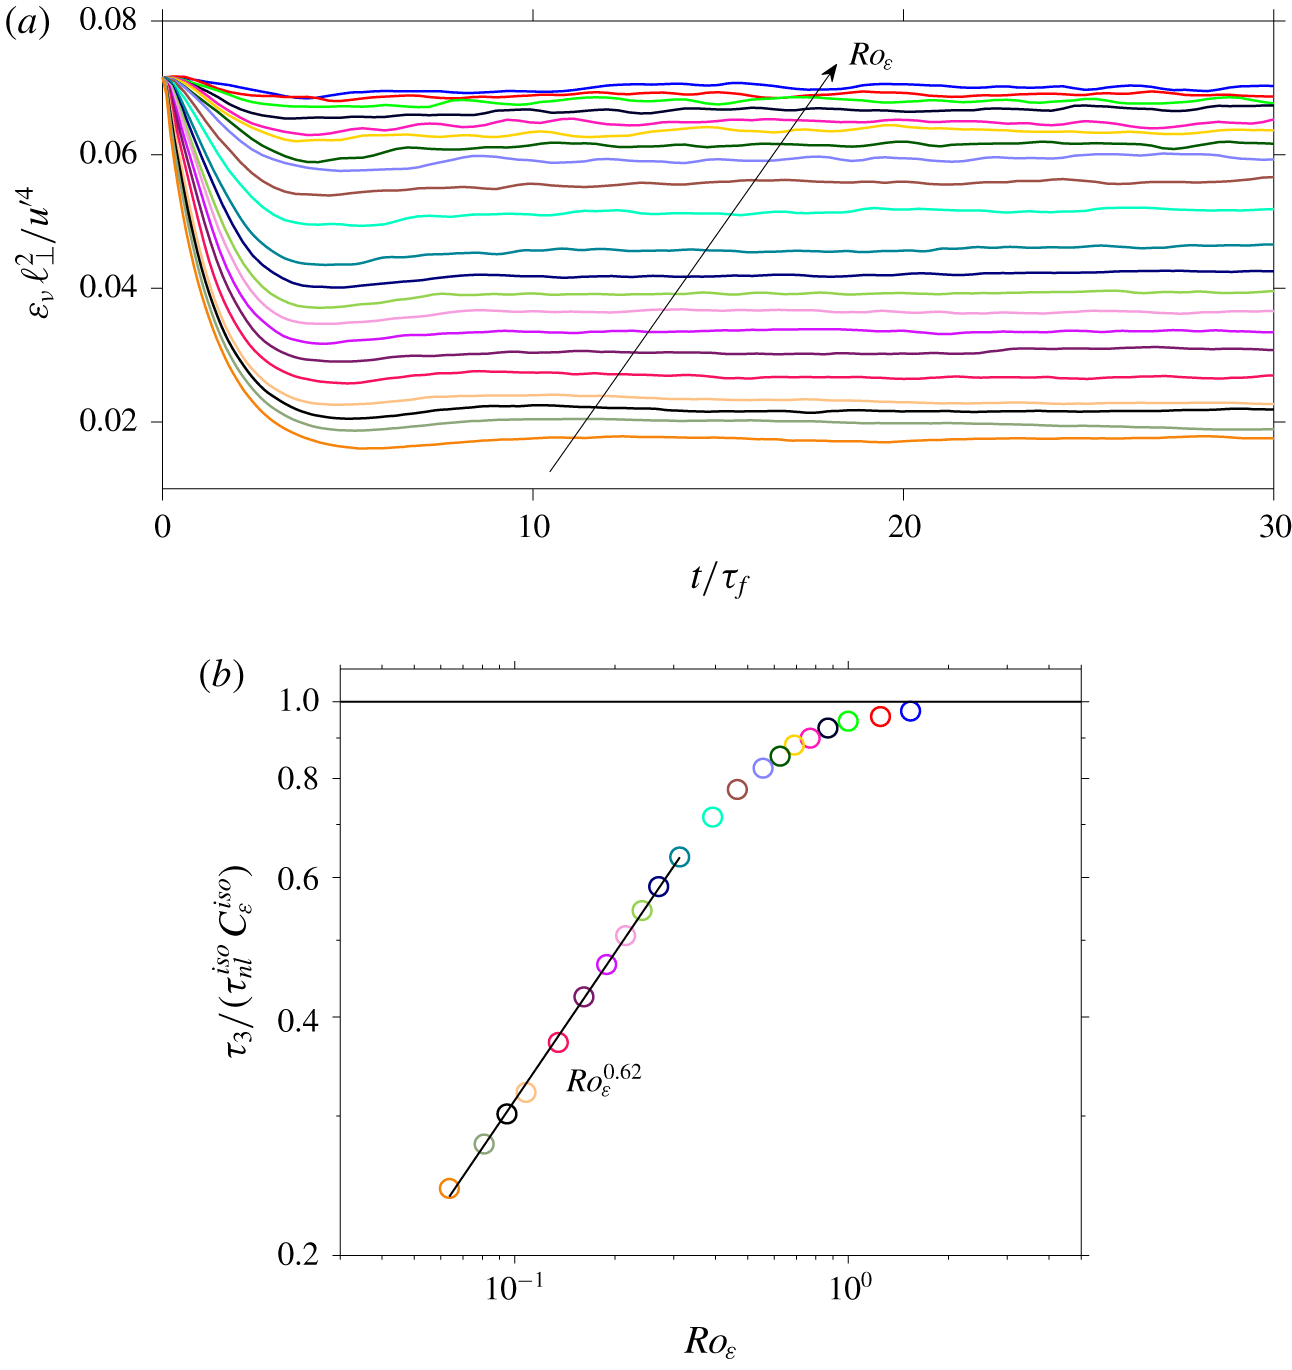
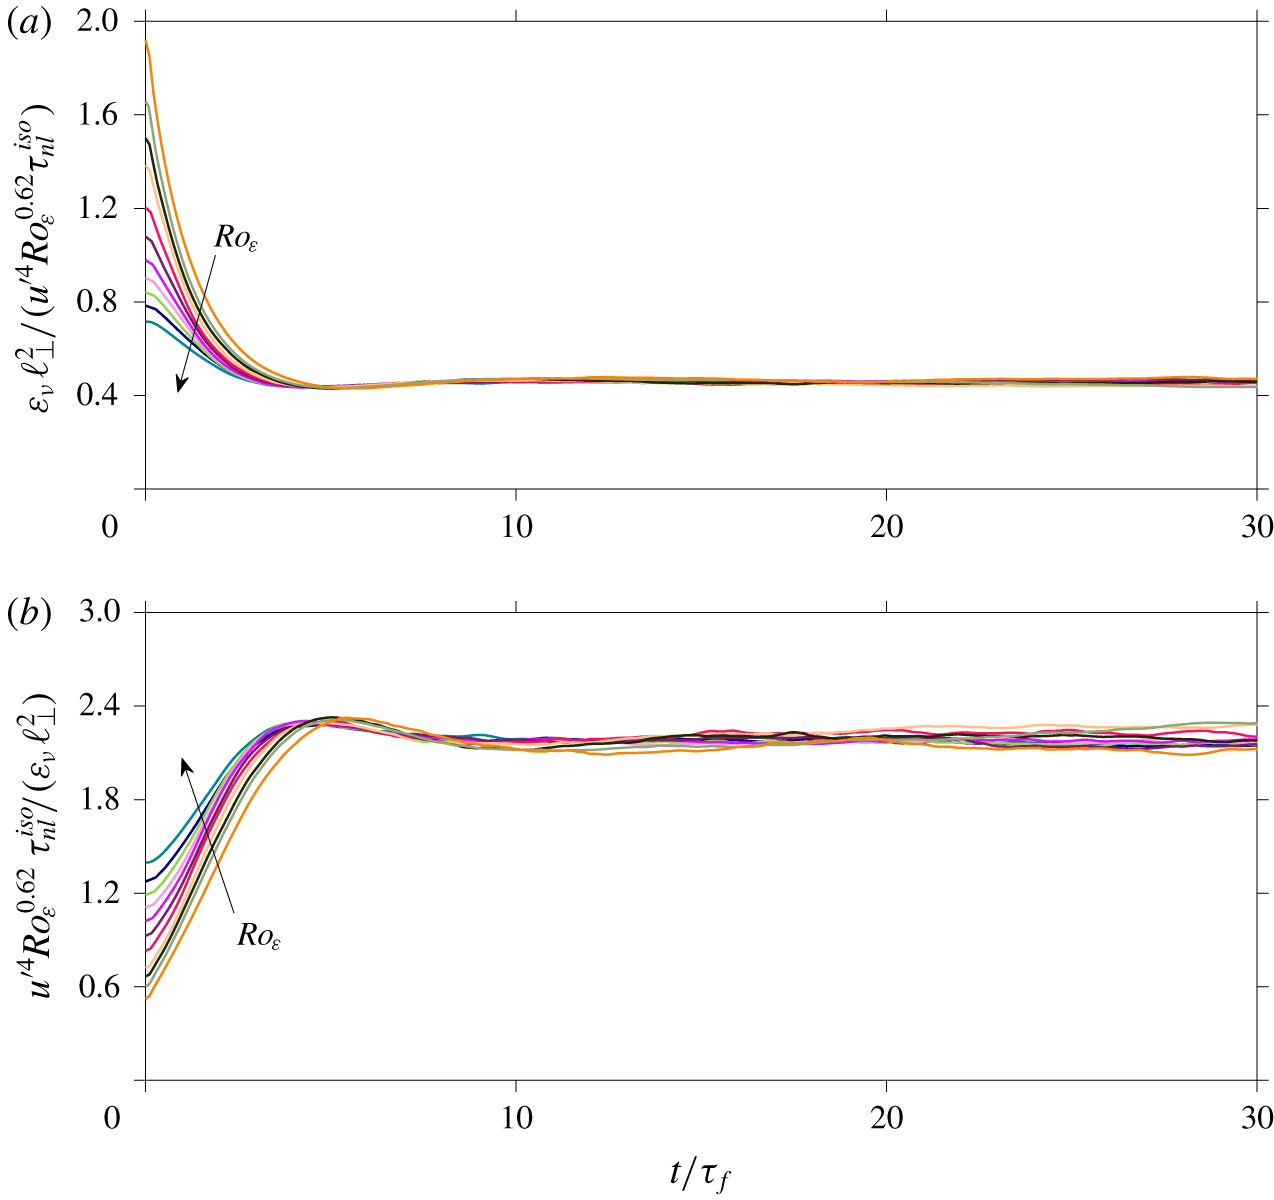
To find a similarity relation for the latter, we exploit the concept of a spectral transfer time introduced by Kraichnan (Phys. Fluids, vol. 8(7), 1965, p. 1385). Within this framework, the energy dissipation rate is considered to depend on both the nonlinear time scale and the relaxation time scale. Thus, by analysing our data, expressions for these different time scales are obtained that result in ??∼(?′4??0.62????)/ℓ⊥2, where ℓ⊥ is the integral length scale in the direction normal to the axis of rotation and ??? is the nonlinear time scale of the initial homogeneous isotropic field.


